|
  |
| |
|
Purpose: |
To demonstrate a clear linkage between Learning and making Money in Manufacturing Companies, |
|
Purpose: |
To demonstrate a clear linkage between Learning and Measurement in Factories, |
|
|
|
|
also: |
To present management levers to increase the rate of making Money, |
|
|
|
|
and: |
To provide a theoretical and emperical underpinning which rationalizes (and makes manageable) the above, |
|
|
|
|
by using: |
The Learning Curve as the central theme. |
| |
If Cost is a time series, can we fit, predict, and manage
it? In 1936, Dr. T. P. Wright published his affirmative answer: Cost(t)=Cost(0) * Q-Bwhere: Q= Cumulative quantity, and B=Slope of the Learning Curve This remained the dominant view until Dutton and Thomas in 1984 wrote: Based on our extensive research, B is not a constant, but is based on "causal factors" which are influenced [and, therefore, can be managed - ed.] by the firm’s behavior. In 1988, Bohn suggested "manageable learning:"
Cost(t)=Cost(0) *
e-K * q / ( E *N
) |
| |
Cost(t)=Cost(0) * e-K * q / ( E *N ) |
|
where: |
K is the product of the factors influenced by the firm |
|
|
q is the square root of the cumulative number of experiments, Q |
|
|
E is the quality of the Experimental design |
|
|
N is the total of all of the sources of Noise |
|
|
|
|
note: |
E can be metricized by the average number of experiments it takes to reveal what was being sought in each experiment. |
|
|
|
|
|
q , K, and N can be further broken down. |
| |
q2 = Q = P * D * ( t / C
) |
|
where: |
q is the square root of the number of cumulative experiments, Q |
|
|
P is the degree of Parallelism ( # of coincident experiments) |
|
|
D is the experimental Duty cycle ( weekly hours experimenting / 168 ) |
|
|
C is the experimental Cycle time ( hours between successive experiments ) |
|
|
t is the elapsed time ( the same t as the parameter in the Cost function ) |
| |
| |
K = T * V * W * S *
F |
| where: |
T is the sufficiency of the Technical knowledge and know-how |
|
|
V is the requisite Variety of possibilities ( the probability that the answer is already in the "community" ) |
|
|
W is the receptivity of the Working environment to learning |
|
|
S is the cohesiveness of the learning team’s Spirit |
|
|
F is the Fluidity of the learning environment ( the ease with which learners can use tools ) |
| |
|
C |
Shorten experimental Cycle times |
Install programmable drive systems |
|
N |
Reduce process and experimental Noise |
Calibrate and upgrade equipment used in tests |
|
E |
Improve Experimental design |
Use "herringbone analysis" and/or Toyota’s "5 Whys" |
|
D |
Increase experimenting Duty cycle |
Snapshot events on all shifts and weekends |
|
P |
Increase Parallelism |
Multiplex experimental platform |
| |
|
T |
Enhance Technical knowledge |
Study Fourier and Nyquest |
|
V |
Increase Variety of possibilities |
Go outside your regular community |
|
W |
Cultivate conducive Work climate |
Inform and include those who are affected |
|
S |
Develop cohesive team Spirit |
Bond for Trust, Respect, and Joy |
|
F |
Increase learning Fluidity |
Make user friendly interfaces and 24x7 access |
| |
| |
|
|
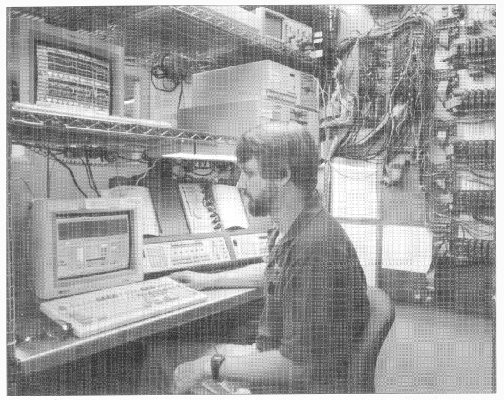
Maarten Meinders, Research
Engineer DuPont's Camden, South Carolina Nylon Plant, Spinning Section Photo © 1995 by National Instruments Corporation |
| |
 |
|
Place |
|
|
Instance |
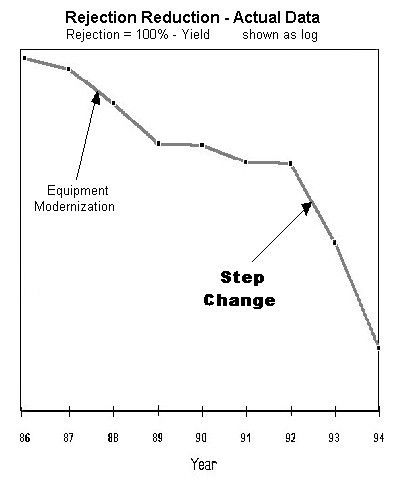
Break Reductions |
|
Unifying Principle |
Minimize Experimental Cycle time |
|
Reconfiguration |
Work on "floor," not in offices |
|
Performance Parameter |
Breaks per pound |
|
Gain in Performance |
3:1 |
|
Cost Reduction |
> $25,000 / day |
|
| ||||||||||||||||||||||||||||||||||||||||||||||